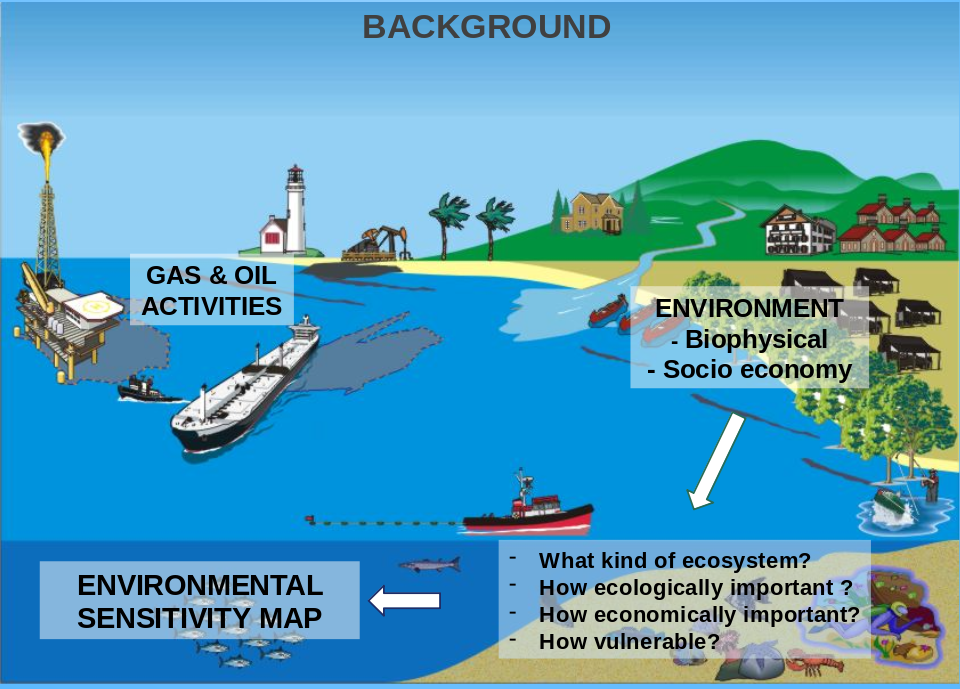
BACKGROUND
Whats is ESI
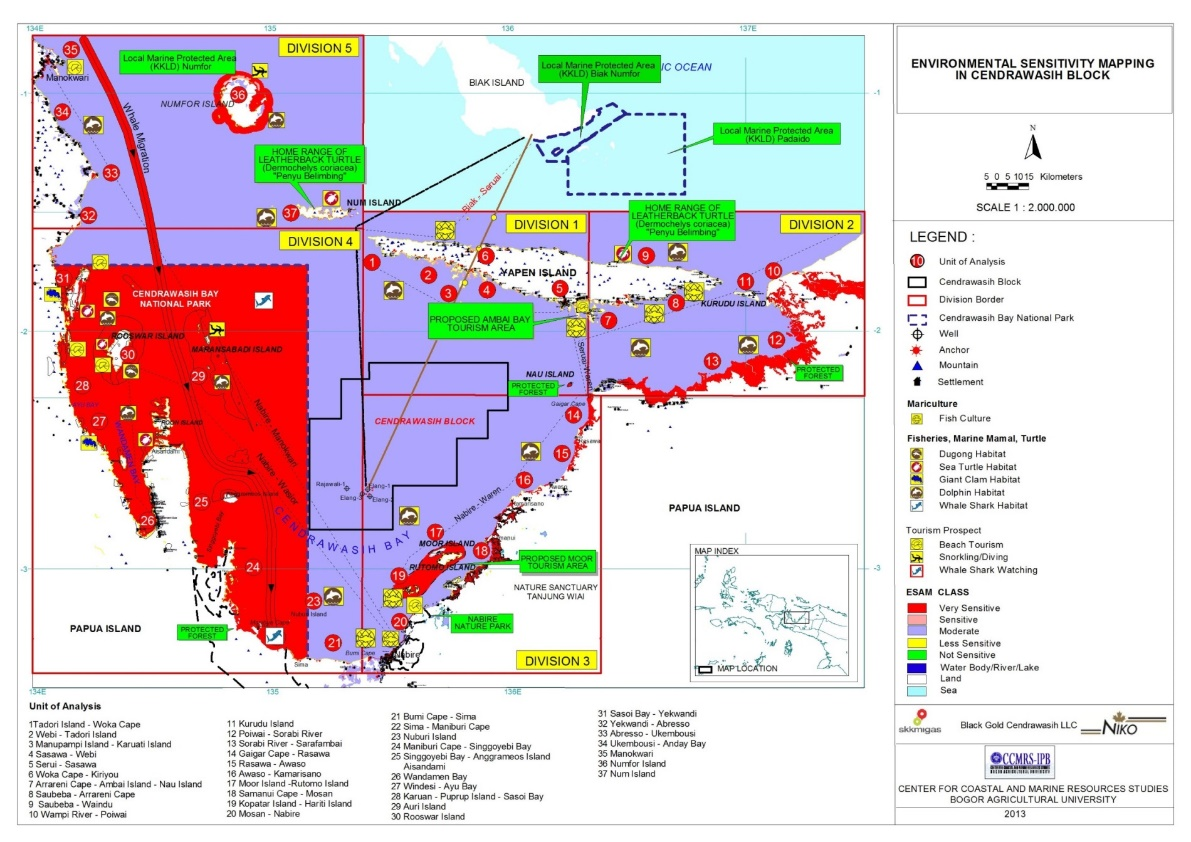
Environmental sensitivity index (ESI) maps are a compilation of information about coastal shoreline sensitivity, biological resources, and human resources. This information is used in planning to create cleanup strategies before an accident occurs so that authorities are prepared to take action in the event of such a spill. Advance planning reduces the harmful consequences of oil spills and cleanup.

Why ESI is Important ?
Coastal area is productive but sensitive, it requires a sensitive area identification :
Prioritizing the area development
Identification of transportation routes
Input for environmental management
Minimizing environmental damage
Integration ESI in Oil Spill Contingency Plan
The Goals
Identification of biological and socio economical environmental sensitive of a coastal area, presented in a spatial map form
Identification of habitat typology and ecosystem function
Analyses of a composite environmental sensitivity index
Identification of socio economy function of a habitat
Mapping of environmental sensitivity index


Benefits
As a basis data for environmental management of the area related to the oil and gas exploration activities (e.g. oil spill response plan).
As an input in protecting a sensitive area and important ecological and economical purposes of the area from oil and gas related activities
Minimizing environmental conflict
Minimizing social conflict
ESI STUDY PKSPL’S EXPERIENCES
METHOD
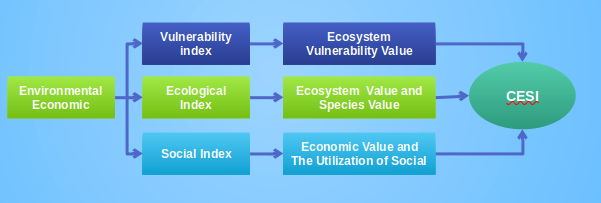
ENVIRONMENTAL SENSITIVITY INDEX ANALYSIS (ESI)
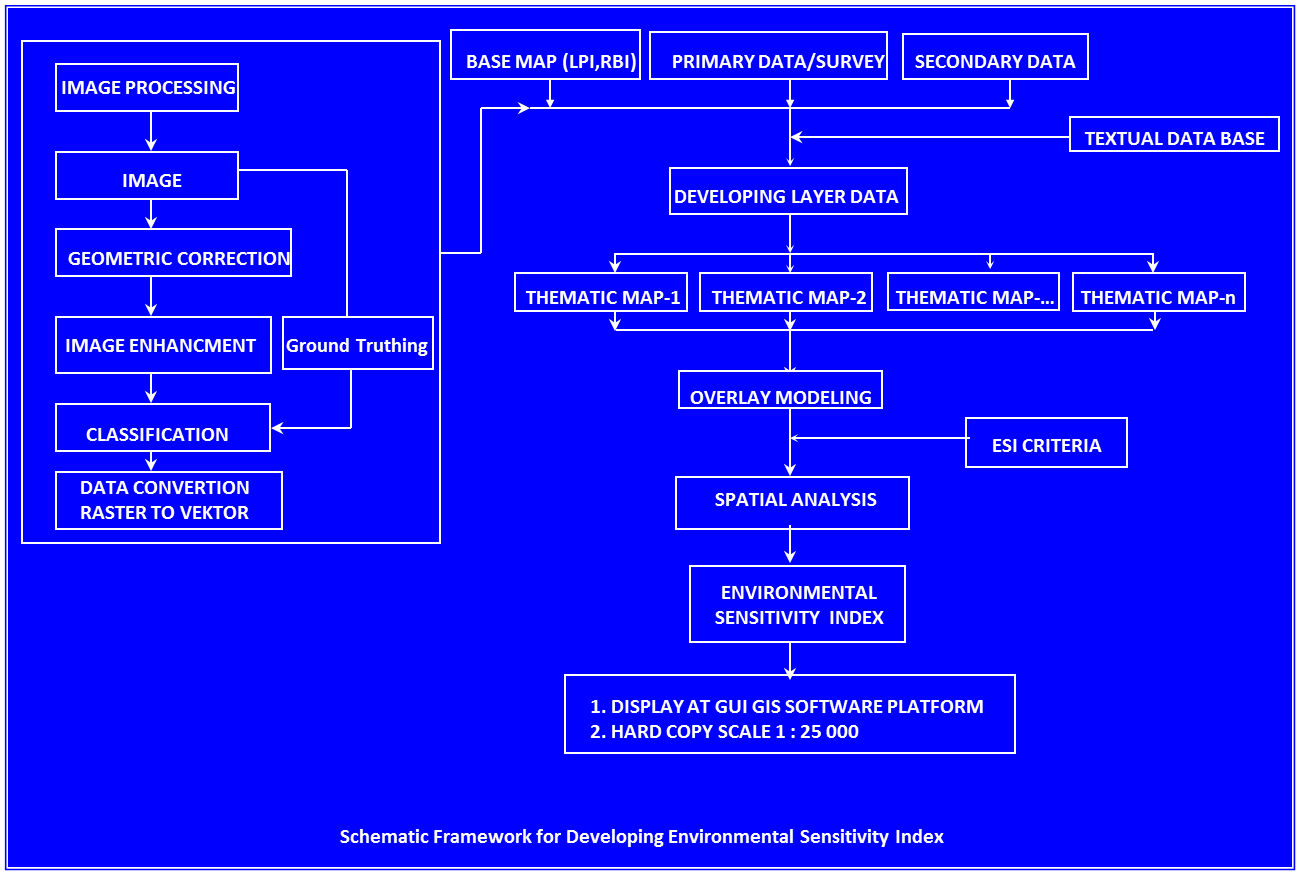
SYSTEM APPROACH OF ESI MODELING
DATA COLLECTION
Shoreline Type
Conducted by using direct visual observation in the study area. Sandy, rocky and/or muddy beach.
Wild Life
Habitat and home ranges: marine mammals, sea turtle, migration birds.
Agriculture Field
- Type of agriculture field (rice, etc.)
- Harvest production
- Applied agriculture technology
Coral Reef
- Coral coverage
- Coral genus
- Coral life form
Socio Economic
- Fishing village
- Port
- Industrial activities
- Infrastructure related to oil exploration, production and transport activities
- Cultural sites (archeological, historical, religious, etc.)
Fisheries
-
Fisheries
activity
(type of fishing activity, fishing gear, fishing fleets, fishing ground, type of mariculture/aquaculture, equipment used, scale of activities and fish processing) - Fisheries resources
Mangrove
| No | Type of Data | Collection Procedures | Equipment |
|---|---|---|---|
| 1 | Mangrove species | In-situ identification | Reference |
| 2 | Number of species | Direct counting | Counter |
| 3 | Diameter of tree | In-situ measurement | Roll meter |
| 4 | Coverage | Coverage estimation | - |
| 5 | Type of substrate | Visual survey | - |
| 6 | Fauna associate | Visual survey | Binocular |
SECONDARY DATA
- Geology
- Bathimetry map
- Satelite imageries
- Other related data
- Geomorphology
- Topography map
- Demographic data
OUTPUT
ENVIRONMENTAL PROFILE MAP
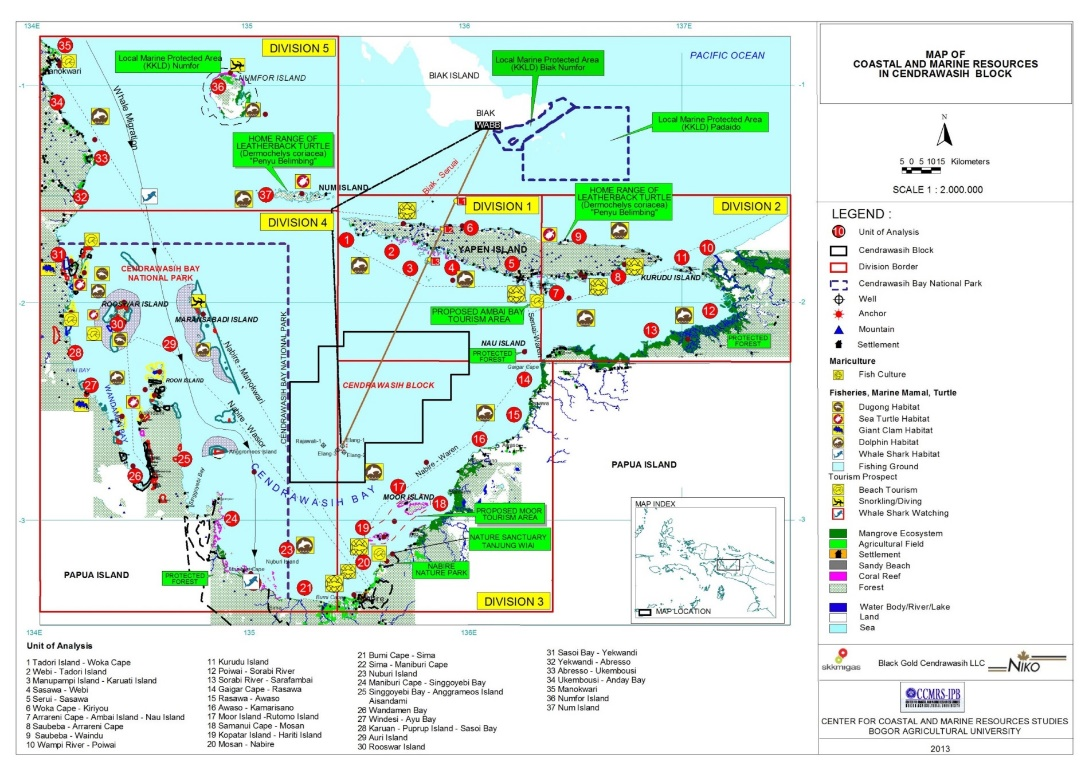
ESI MAP